1. Shortlist
Mutual information proposes frames the labels already collected do not cover. Each method then spends the same number of real KITTI evaluations.
SCOUT spends a small target-system budget where a cheap proxy is informative, and uses support-aware mutual information so those labels cover more than one failure mode.
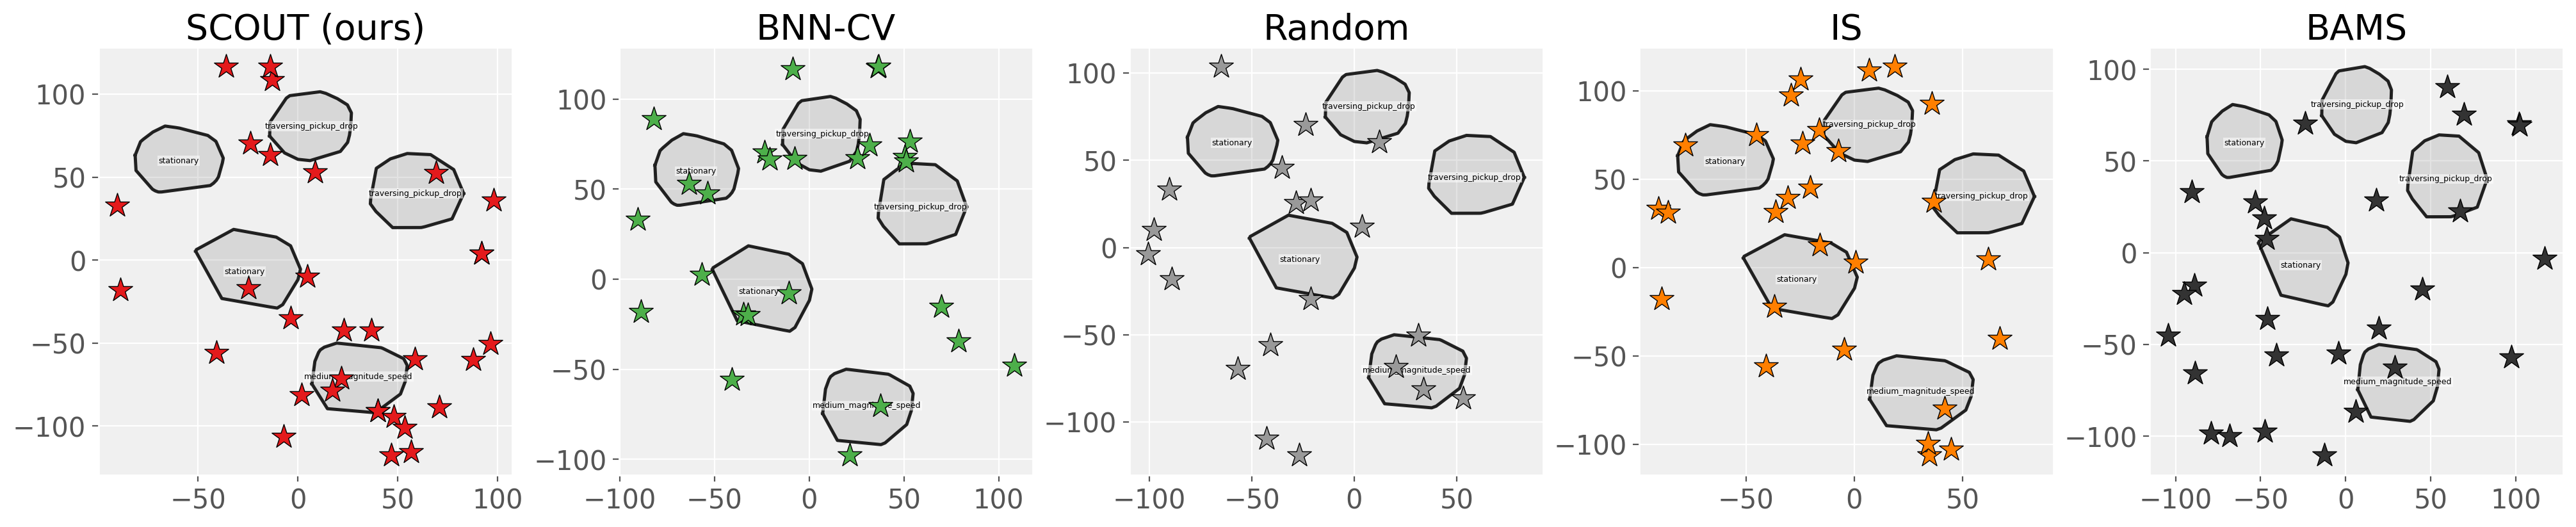
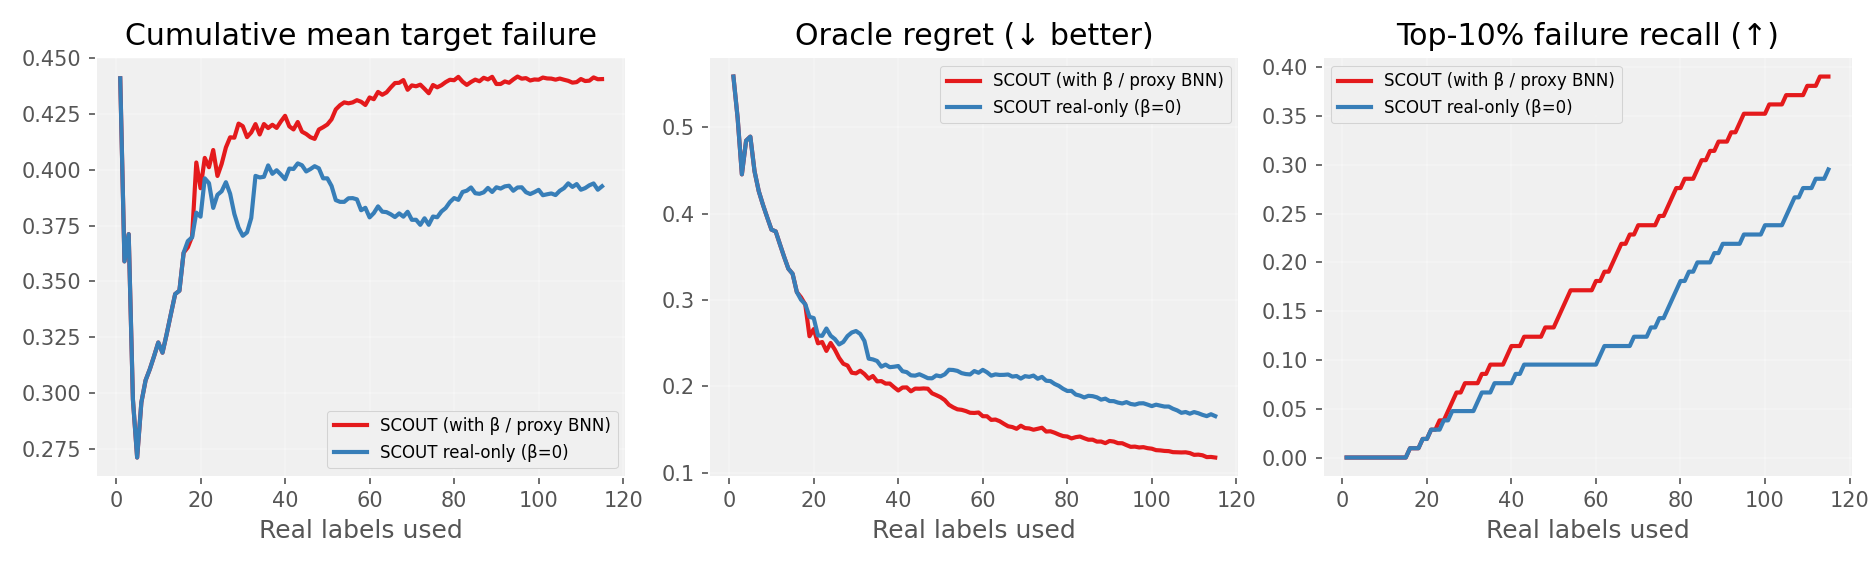
Failure is the missed-car score on real KITTI: one minus the average overlap between the detector’s boxes and the ground-truth cars. A frame counts as severe when that score is at least 0.45. Proxy only ranks frames by the simulator surrogate. Real only spends the same labels without that surrogate. The map groups frames into islands and colors each island by how severe the frames there are. Marks are the frames that method has labeled, so coverage shows up inside the hotter islands.
KITTI
Virtual KITTI clone
Loading the KITTI acquisition…
Fifteen clips step through all 85 real labels. The pictures are frames our method labeled.
Mutual information proposes frames the labels already collected do not cover. Each method then spends the same number of real KITTI evaluations.
On the shortlist only, a local control variate estimates the target score from the surrogate and the free simulator. The proxy is a covariate, not the answer.
Each method labels 85 real KITTI frames from the same 10-frame start. The pictures skip ahead through that run, about 15 clips in all.
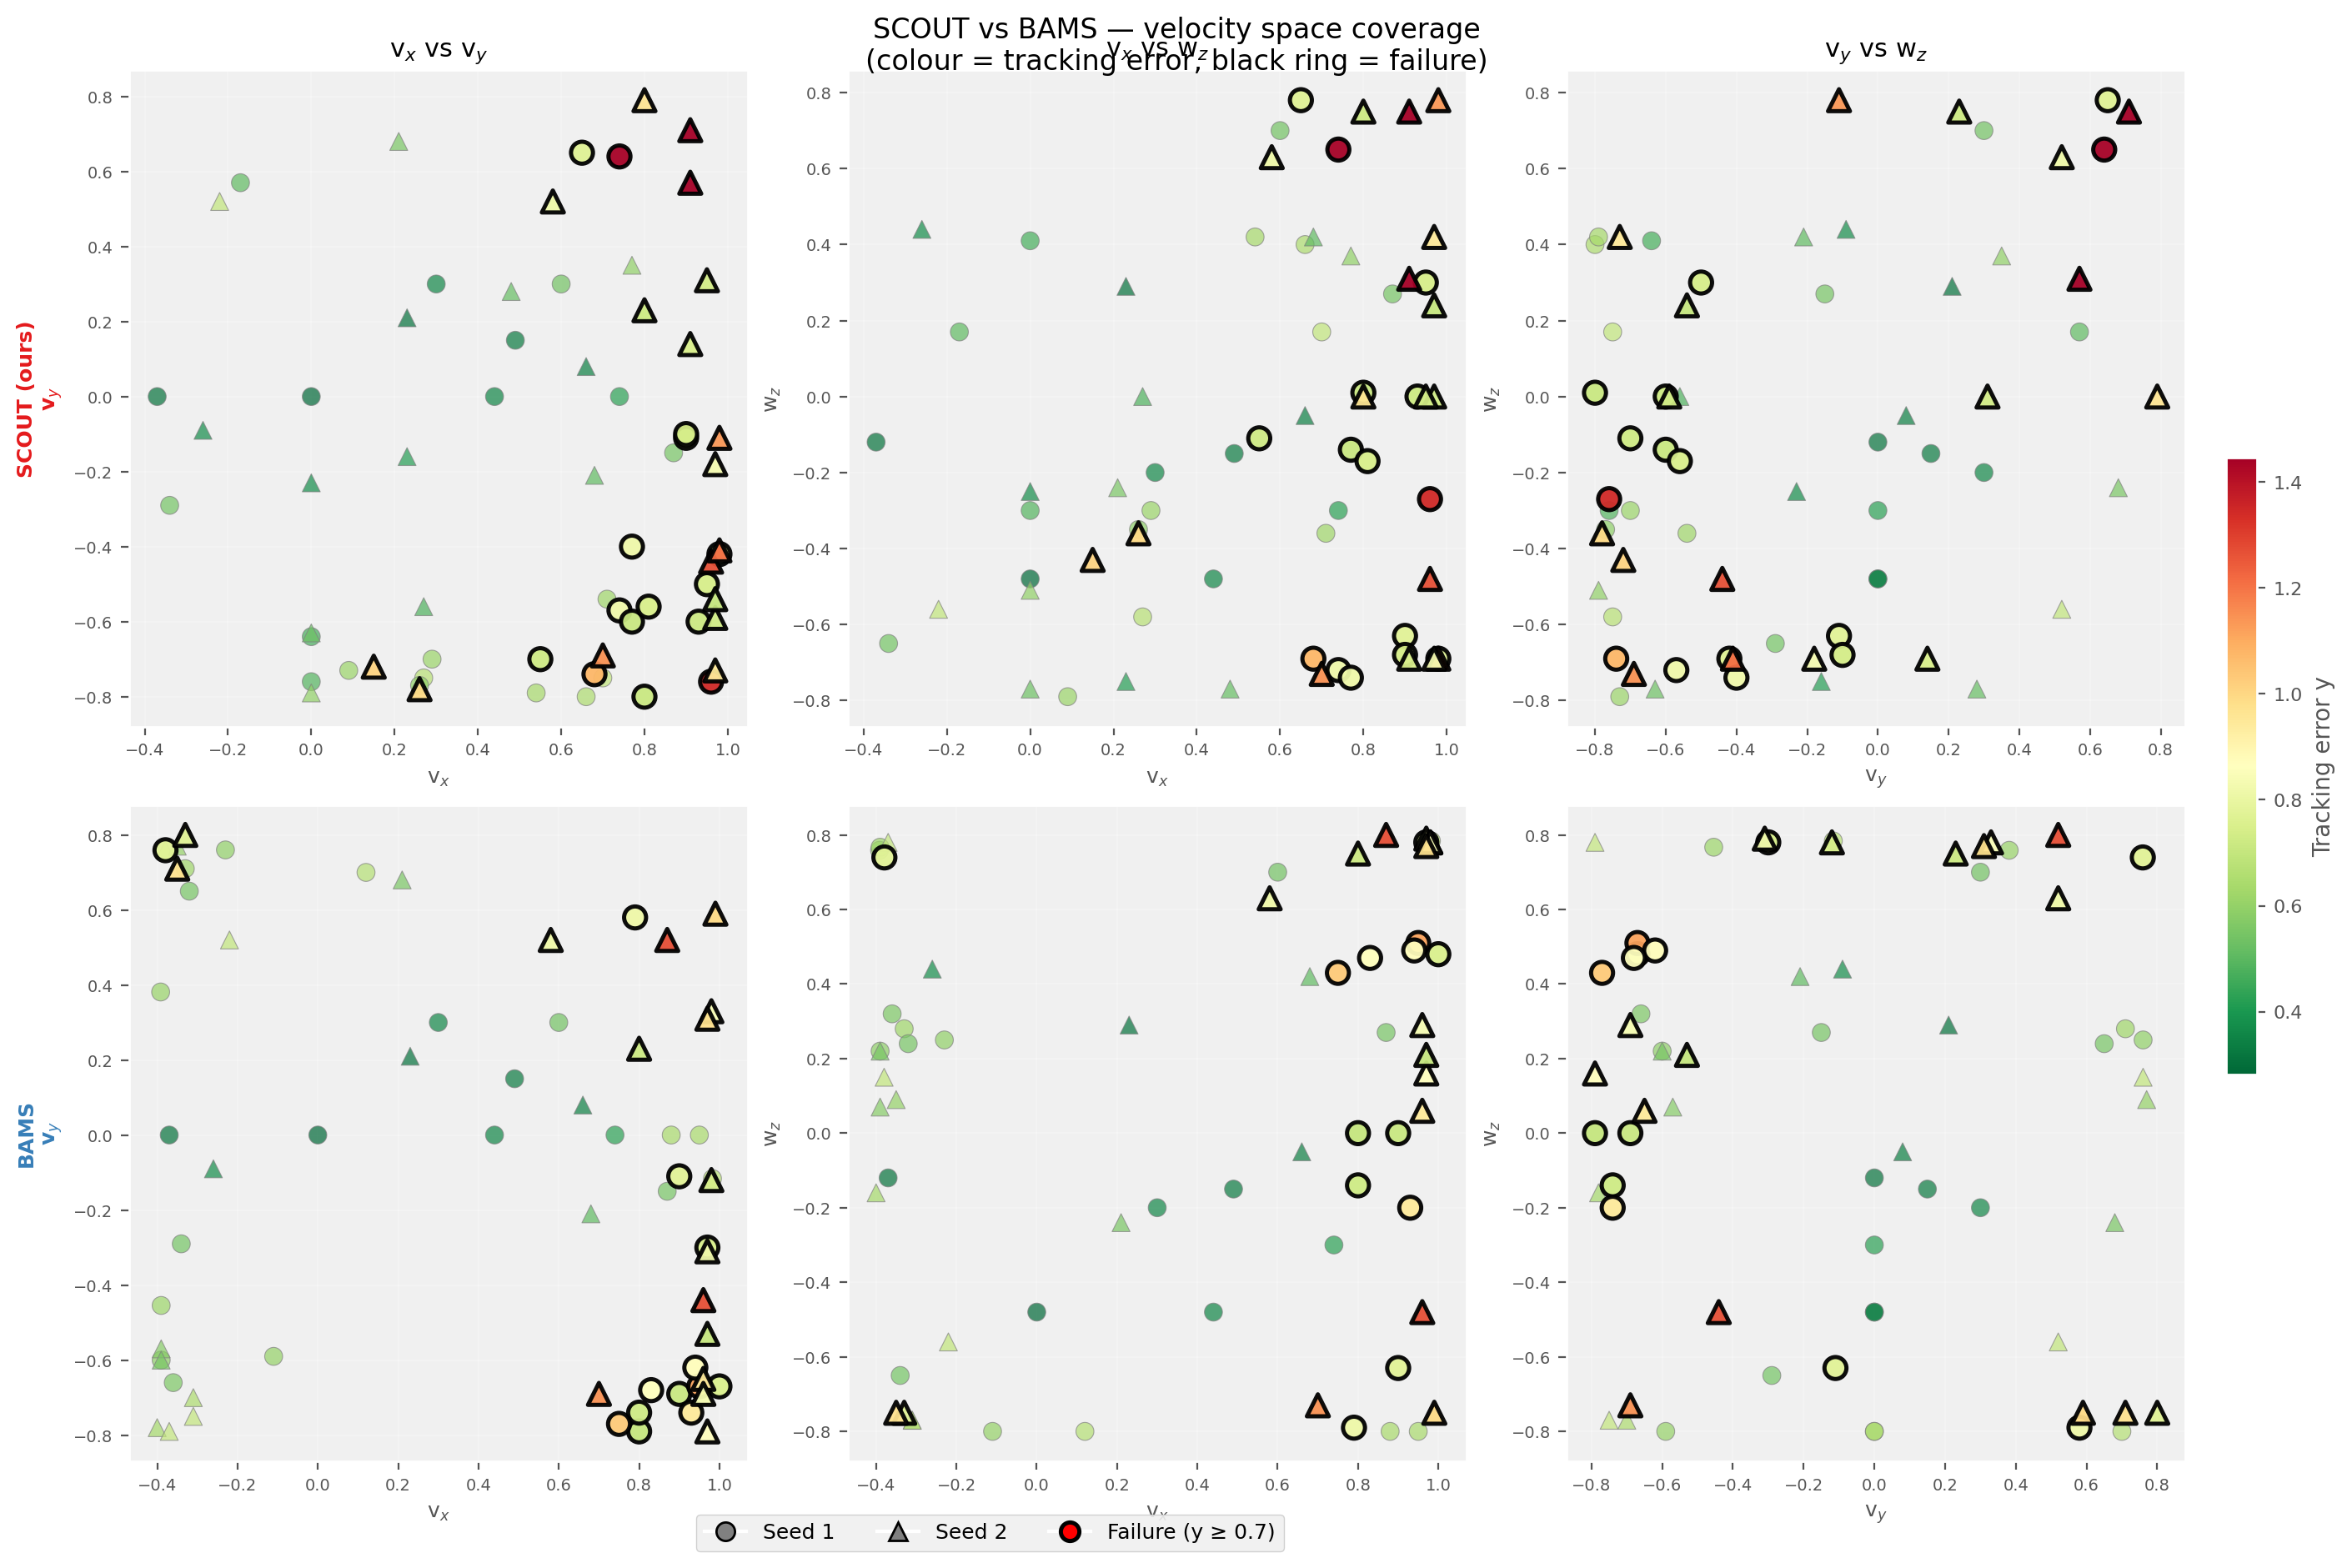
Quadruped velocity-tracking on a Unitree Go2. The commands in the video are ones the method predicted as failures or as a non-failure.
The supplementary file docs/assets/video.mp4 is not in this checkout yet.
Same grasp, two visual simulators. The gap case is a success in the proxy and a miss on the target.
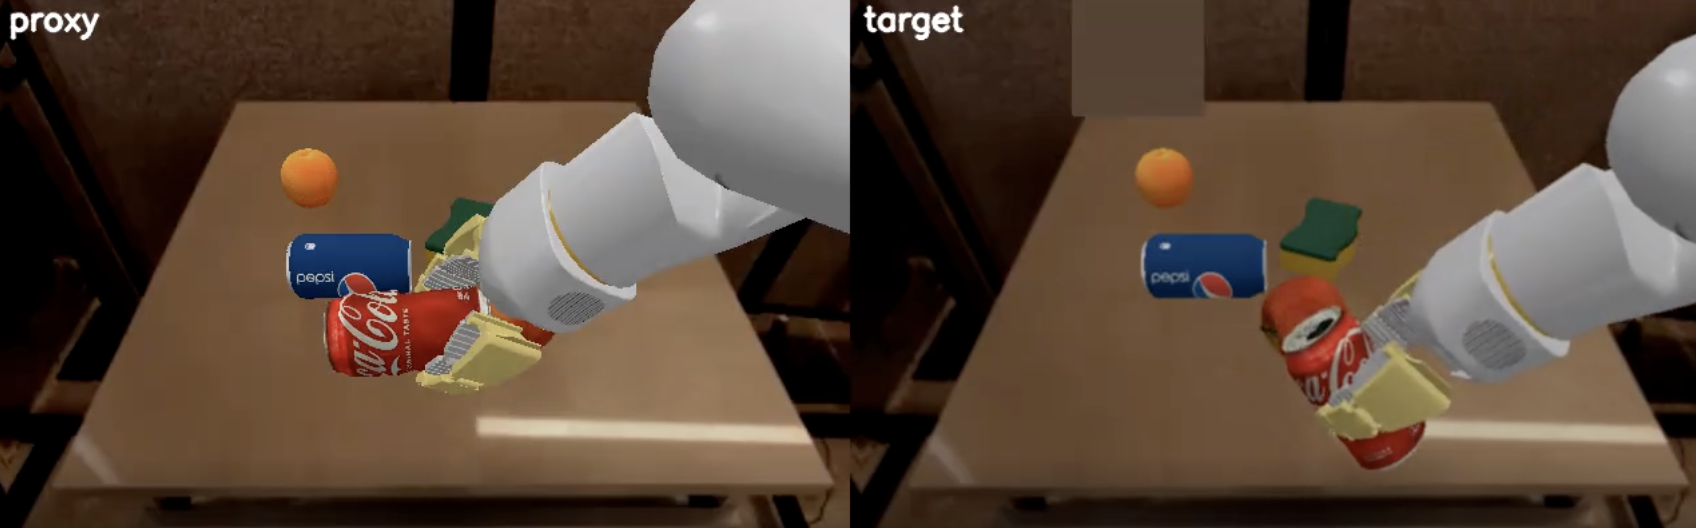
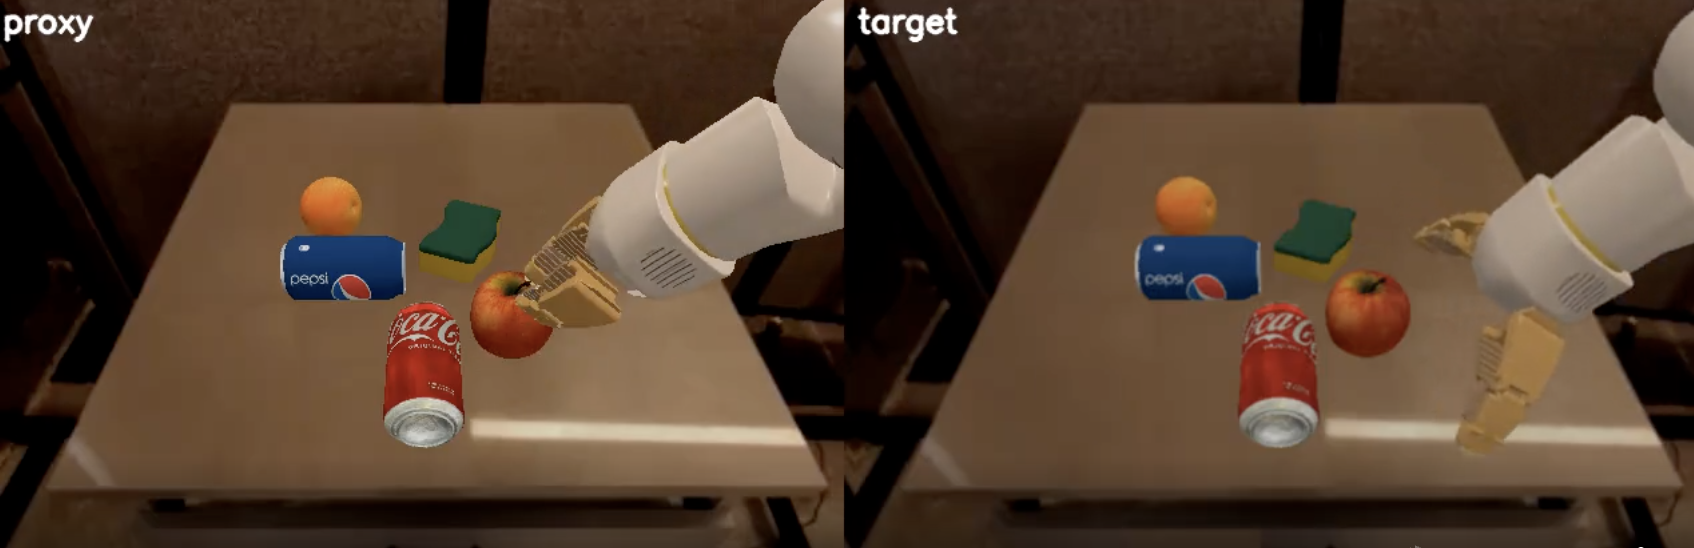
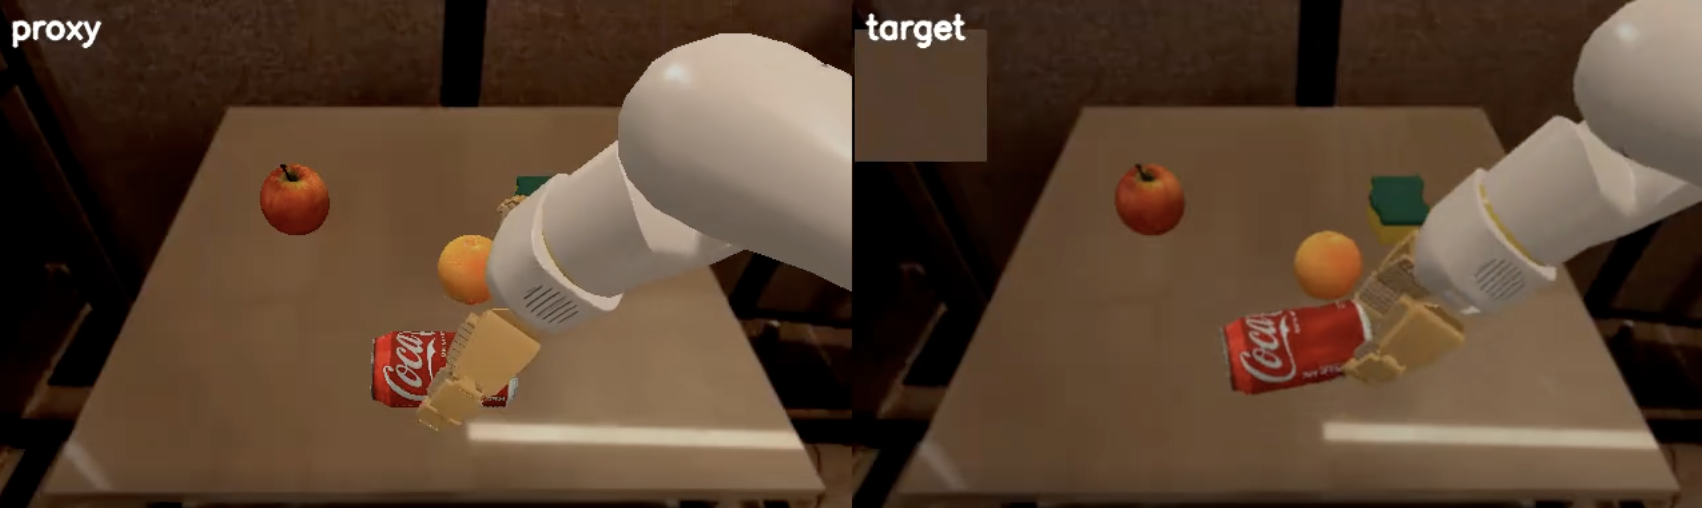
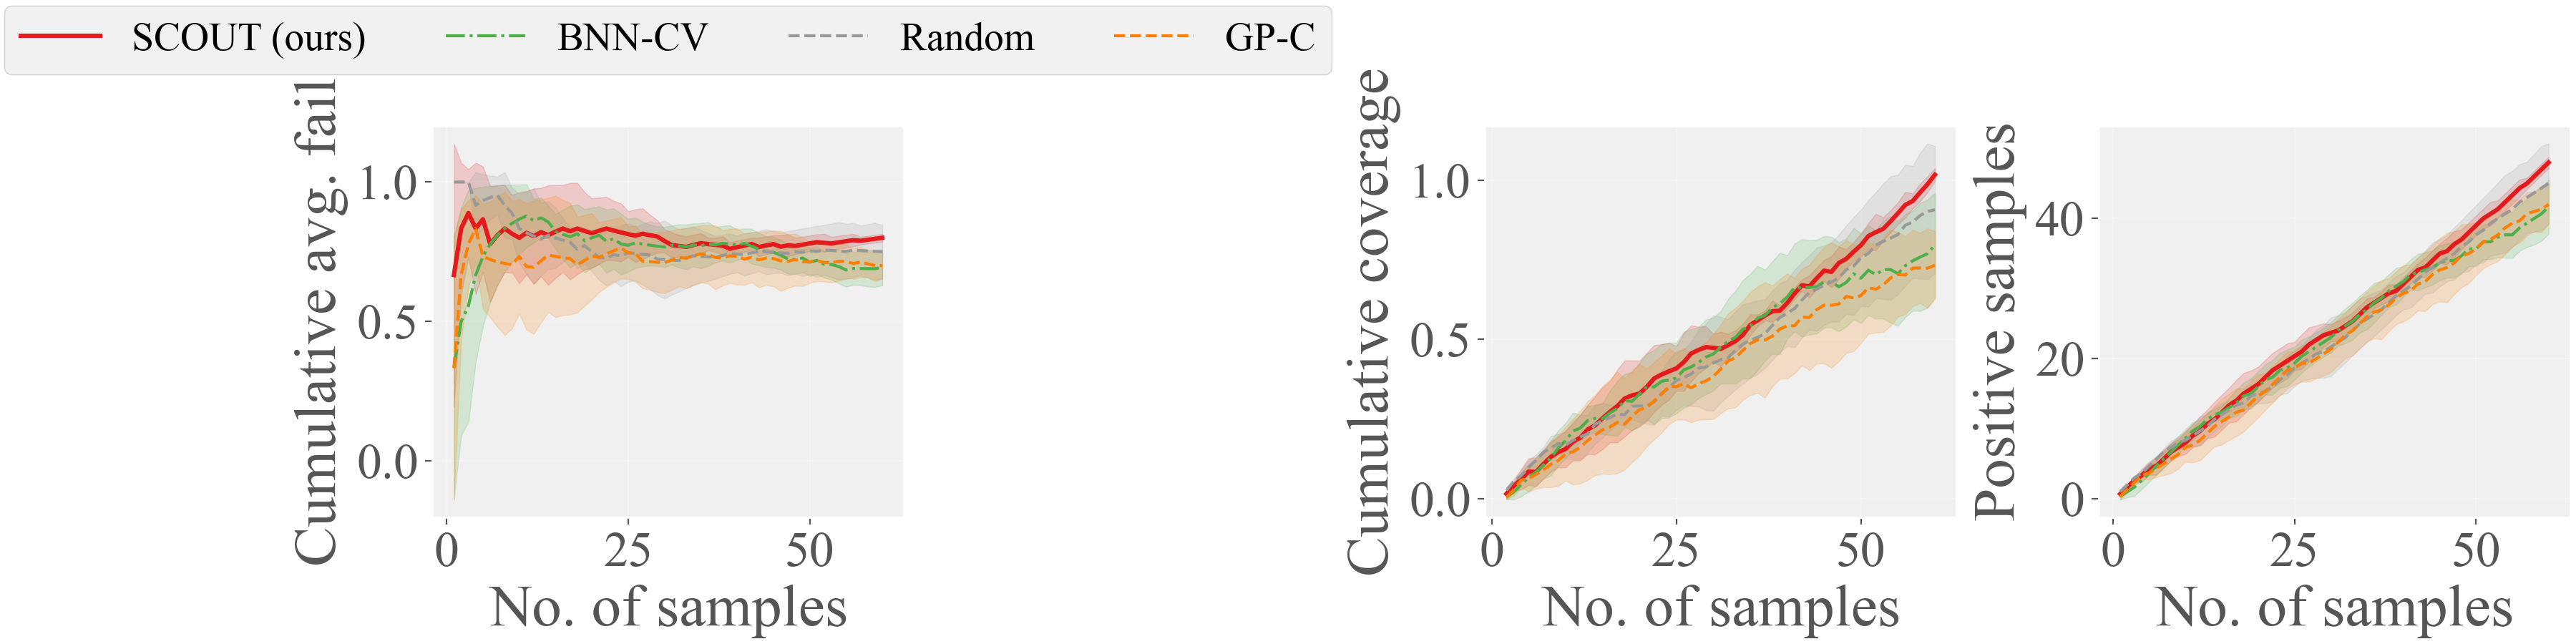
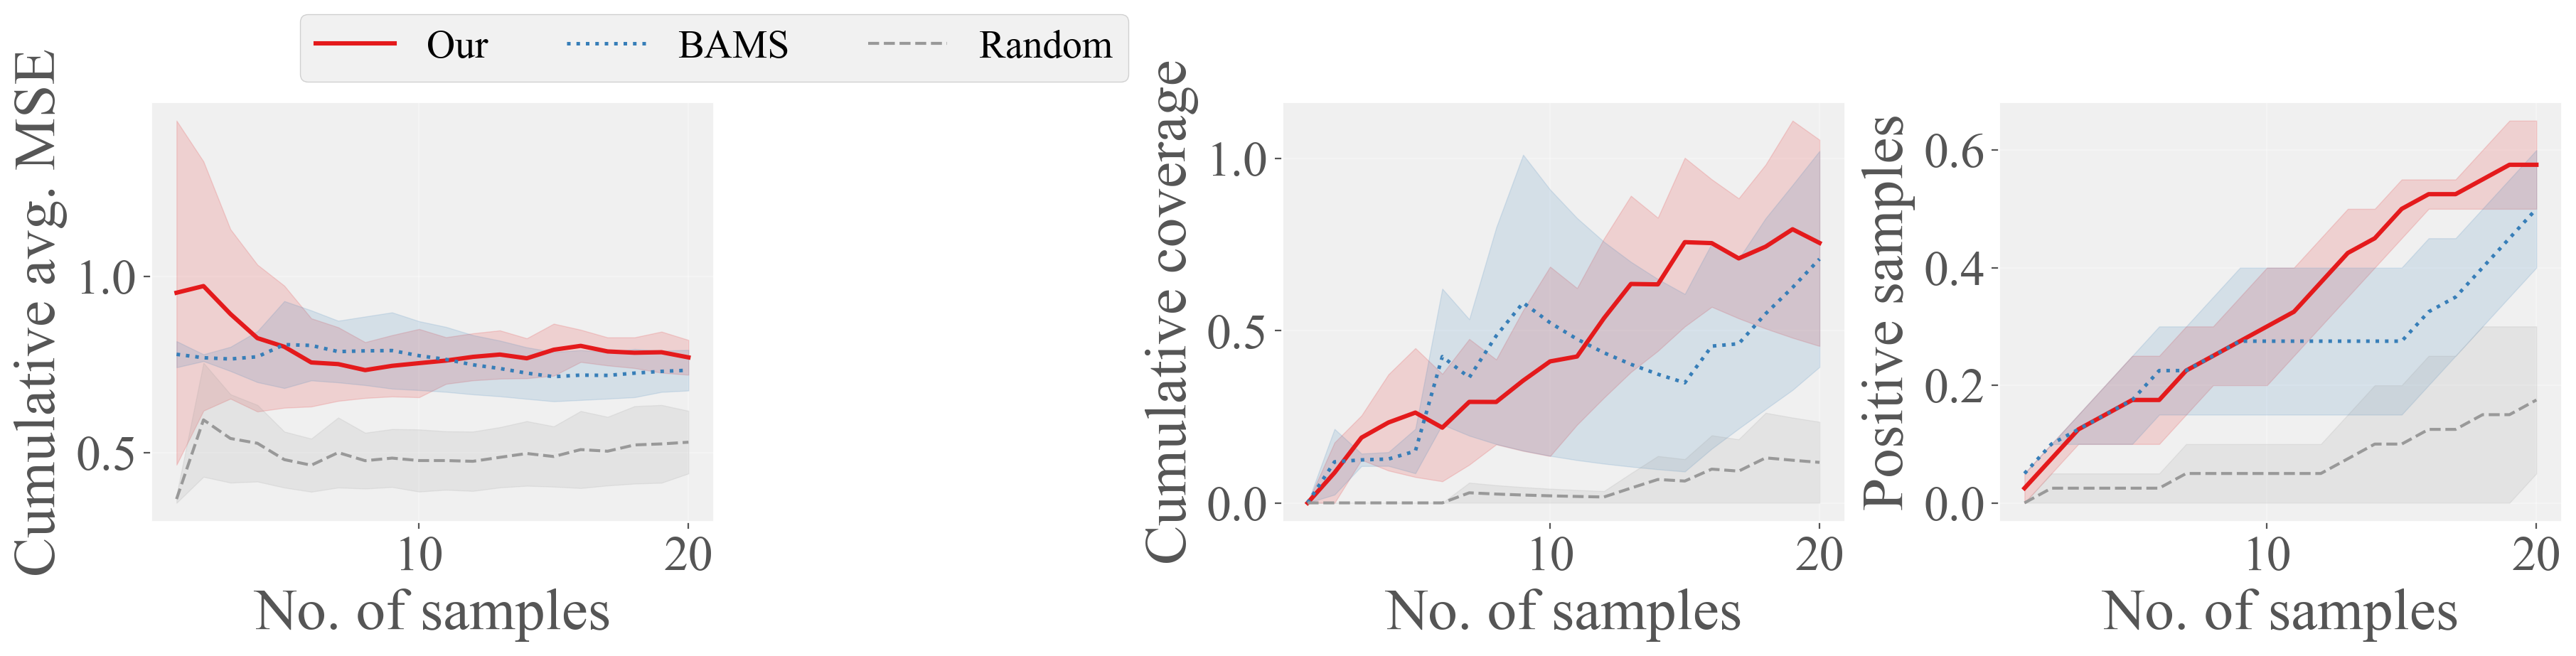
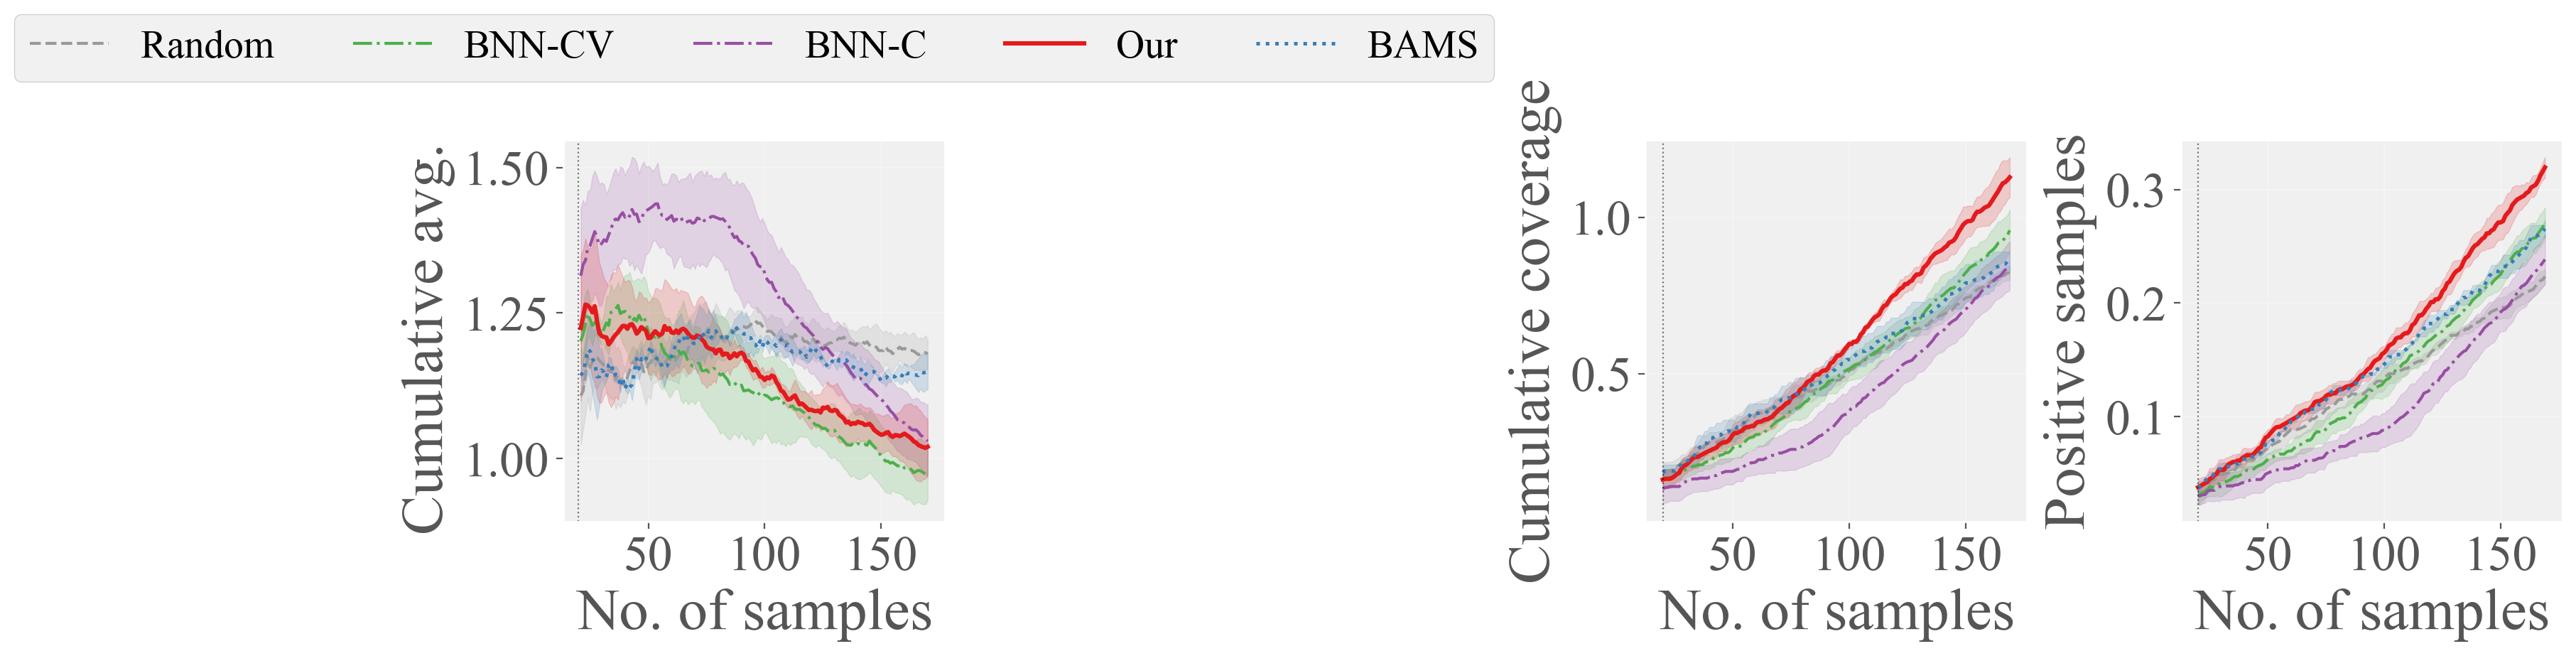
Same target budget for every method. Curves are mean ± std from the paper runs in the research repository, including nuPlan.
| Threshold γ | Random | BNN-C | BAMS | BNN-CV | Ours |
|---|---|---|---|---|---|
| 0.30 | 0.23 ± 0.01 | 0.25 ± 0.01 | 0.28 ± 0.01 | 0.27 ± 0.01 | 0.33 ± 0.01 |
| 0.20 | 0.22 ± 0.00 | 0.24 ± 0.02 | 0.27 ± 0.01 | 0.26 ± 0.01 | 0.32 ± 0.01 |
| 0.05 | 0.21 ± 0.01 | 0.21 ± 0.02 | 0.25 ± 0.01 | 0.22 ± 0.02 | 0.29 ± 0.01 |